Swing Viewer
Overview
The Swing Viewer is a standalone coverage viewer that allows you to browse coverage results and generate coverage reports.
Launching the viewer from Ant
Add the following target to your build file:
 <target name="clover.view" depends="with.clover">
    <clover-view/>
 </target>
The viewer can then be launched with ant clover.view.
Launching the viewer from the Command Line
To launch the Swing viewer from the command line:
java com.cenqua.clover.reporters.jfc.Viewer <initstring>
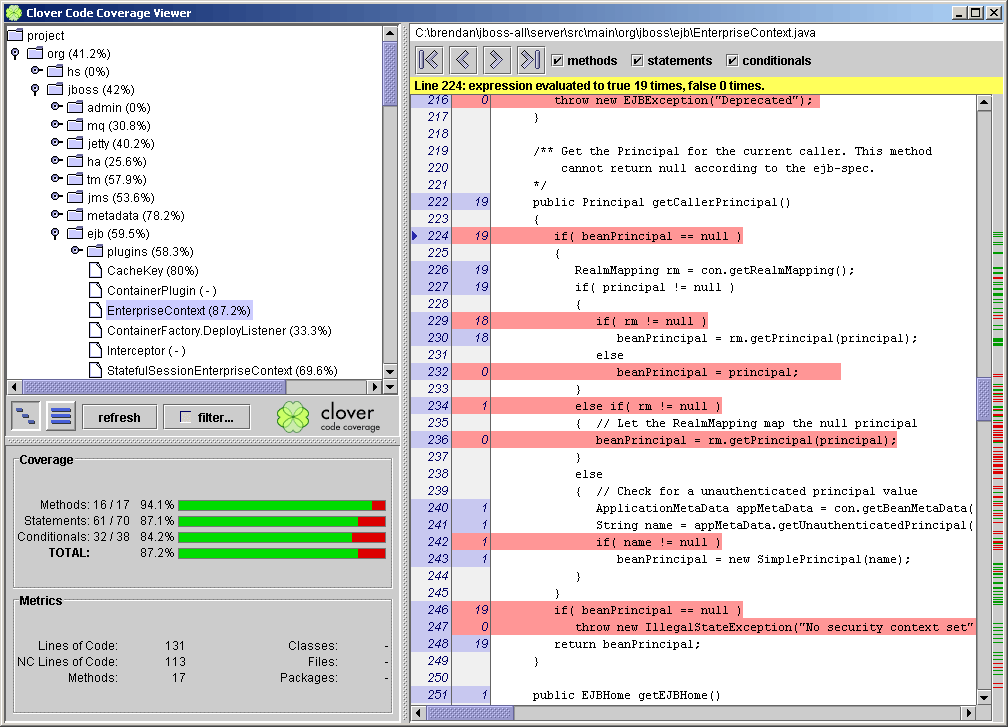
The swing viewer will appear in a new frame which will look like the following (sections of this image are displayed in greater detail below):
Package View
In the top left hand corner you will see the Project Package View which gives you a quick snapshot of the coverage percentage of each package. The two buttons on the left below the Package View allow you to choose between a nested view of the packages or a flat view. The button on the left will display the packages in a hierachical structure whereas the button to the right will display each package separately.
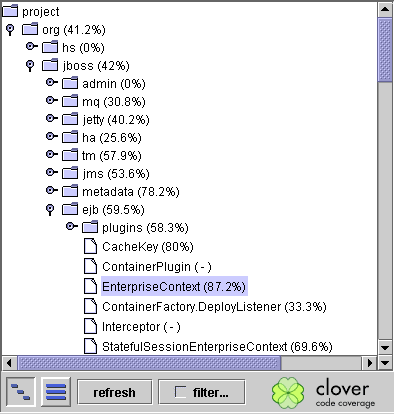
The 'refresh' button will reread coverage data and will update the display accordingly. This allows you to change, re-compile and test code while the swing viewer is running and then instantly see the new code coverage results.
Clicking on the filter button opens up a new frame that allows you to filter the displayed coverage. The context filter allows you to select certain blocks to ignore when calculating coverage, and the coverage filter allows you to specify a level of coverage that needs to be achieved before the class is displayed. Once the filtering has been selected, click 'Apply' to see the results. 'Reset' will return to the default settings, and 'Cancel' will leave the settings as they were.
Double-clicking on a package or selecting the icon to the left of the package name will display all the files that exist within that package. These files can then be selected and the file will appear in the window to the right for closer examination (see Code View section below).
Coverage and Metrics
Depending on the current selection in the Package View, the relevant coverage details and statistics will be displayed in the two sections below the project packages.
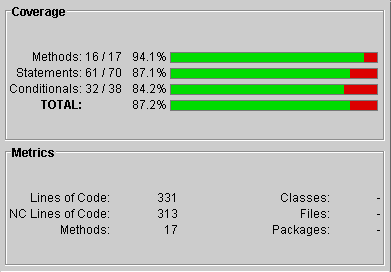
The coverage details show the method, statement and conditional coverage. The statistics in the bottom left give the metrics of the selection in the project package section and provide details such as the number of lines of code, number of classes, etc.
Code View
The window on the right of the Swing Viewer (shown below), which displays your selected file, allows you to see exactly which sections of your code remain uncovered, much like the HTML Reporter. The name and location of the file are shown at the top of this window, and clicking on the left and right arrows below this allow you to cycle through the coverage of one file. The check boxes beside this can be used to omit or include method, statement or conditional coverage.
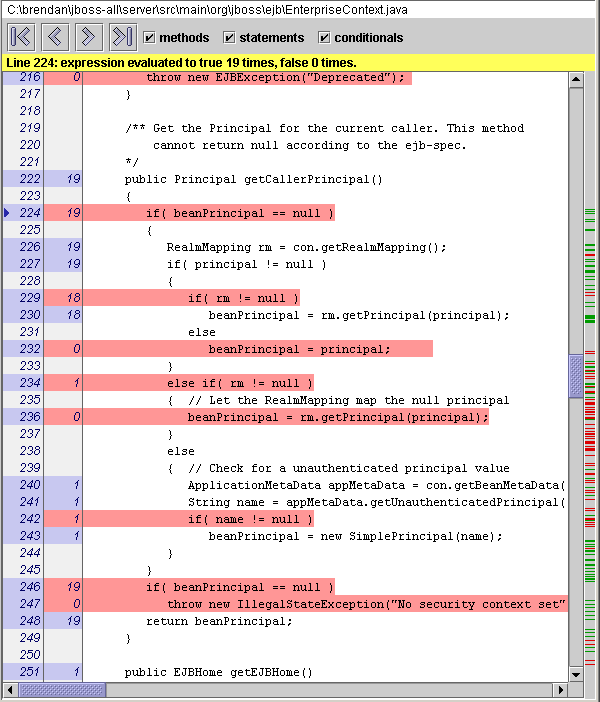
The non-comment lines of code have their numbers highlighted in blue and beside this is the number of times a line has been executed. This second number is highlighted in red if the line has never been executed, and blue otherwise.
The 'quick jump' bar on the furthest right of this window highlights lines that have not been covered by the testing. Clicking on the dashes beside these lines allows you to instantly skip to the uncovered sections of code.
Generating Reports
The Swing Viewer can be used for generating other types of reports.
To generate reports, click on 'File' and select 'Generate other reports'. This will bring up a new frame allowing you to choose which sort of report you want to generate and also configure other options relevant to specific reports.
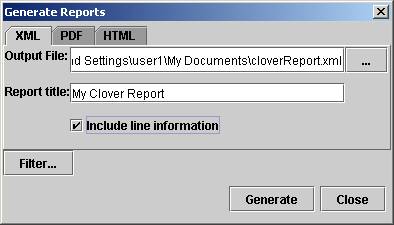
For all three report types that you can generate, you must specify an output path. For XML/PDF, this is a file, and for html, this is a directory. You can also add a report title if you wish. By clicking the 'Filter' button you can again select specific blocks to exclude when generating the report.
The XML report gives you the option of including line information which details the line number, the line type (method/statement/conditional) and the execution count (in the case of a conditional, the true count and the false count).
When generating the HTML report you can select whether or not you want the source files to be shown, including coverage information, by checking the 'Show source' check box. You can also choose to sort the classes alphabetically, by ascending coverage, or descending coverage.
To generate the report simply click 'Generate' and a pop-up will be displayed saying the type of report generated and the path of that report. If, for instance, you select an invalid path, a relevant error message will be displayed detailing the problem.

You can now view the generated report by opening it in a relevant application.