Coverage Display
Coverage Display
Clover.NET is able to display Coverage information directly in the Visual Studio Editor using text markers. You may be familiar with text markers when using breakpoints in the debugger. Clover.NET has four different types of markers:
| Method coverage marker | Indicates that a Method has not been entered |
| Conditional coverage marker | Indicates that a conditional expression has not taken on both true and false values. |
| Statement coverage marker | Indicates that a statement has not been executed |
| Covered marker | Indicates that the code has been covered |
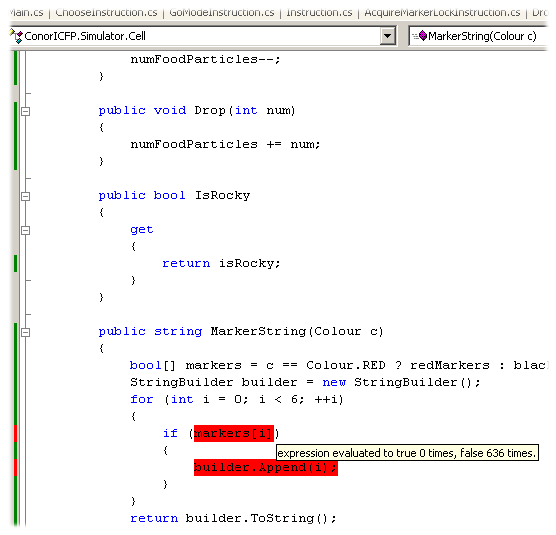
An example of some of the markers in use is shown below:

All markers display tooltips to give more information about the reason why the coverage is not shown. This is especially useful for understanding why coverage of a conditional expression is highlighted. When you hover over the conditional, you will be able to see whether the expression has never evaluated to true, false, or neither value. In the above example we can see that the markers array never contained a true value.
Visual Studio renders the tooltips at the end of the marker area so in some cases the tooltip may not be visible. For methods, you may collapse the method display to more easily view the tooltip.
Since markers may overlap, Clover.NET will not create markers which are unnecessary. When a method has not been entered, for instance, the statement and conditional markers for the method's code will not be displayed since that information would be redundant. When a method has been entered but contains statements that have not executed, the Covered marker is used for the method, with the statement marker having a higher priority and rendering for the appropriate statements. You can see this in the gutter of the example above where the conditional and statement markers override the method's Covered marker
The "covered" marker will indicate how many times a statement or method has been executed or entered. This number is aggregated from all coverage recordings from the current version of the code on display. This information can be handy in some cases to confirm that tests are executing as you expect but you must be careful to interpret this correctly when there are multiple coverage recordings relevant to the current code.
The covered marker only renders in the gutter, it does not affect the normal display of text in the editor window, although such code will display a tool tip.
Since Visual Studio uses markers for other purposes, such as breakpoints it is possible to turn coverage display on and off quickly with the Display button on the toolbar.
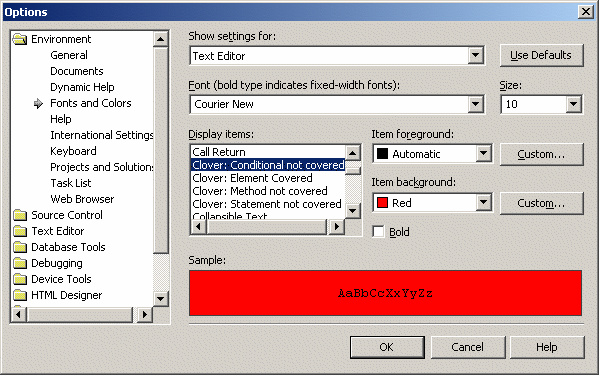
By default the coverage markers use a standard Visual Studio red color as the background to source elements which have not been covered. This can be rather garish but can be customized by Visual Studio just like any other marker. To do this, select the Options item from the Tools menu. In the dialog, select the "Fonts and Colors" entry from the Environment folder. The Clover related markers all appear as entries prefixed by "Clover :" as shown in this image:

You can choose any colors you like for the markers, either standard Visual Studio colors or a custom color. You can select different colors for each marker if you prefer. These colors do not affect the colors used in gutter coverage icons. Although its color can be customized, the covered marker will not display colored text. The following shows the display of all markers customized to different colors.
